We’ve been working with Measurement Protocol for a while now and have encountered situations that were challenging to debug. If we had thought about these 5 things, we could have saved ourselves a significant amount of time.
What is Measurement Protocol?
Measurement Protocol is a method prescribed by Google that allows you to send user interaction data directly to Google Analytics. You can learn more about Measurement Protocol here.
Tip 1: Check your view timezones
You can often forget the most obvious scenarios when you’re frantically searching for hits.
To check your view timezone, head to Admin > View > View Settings. You’ll see it underneath your website URL.
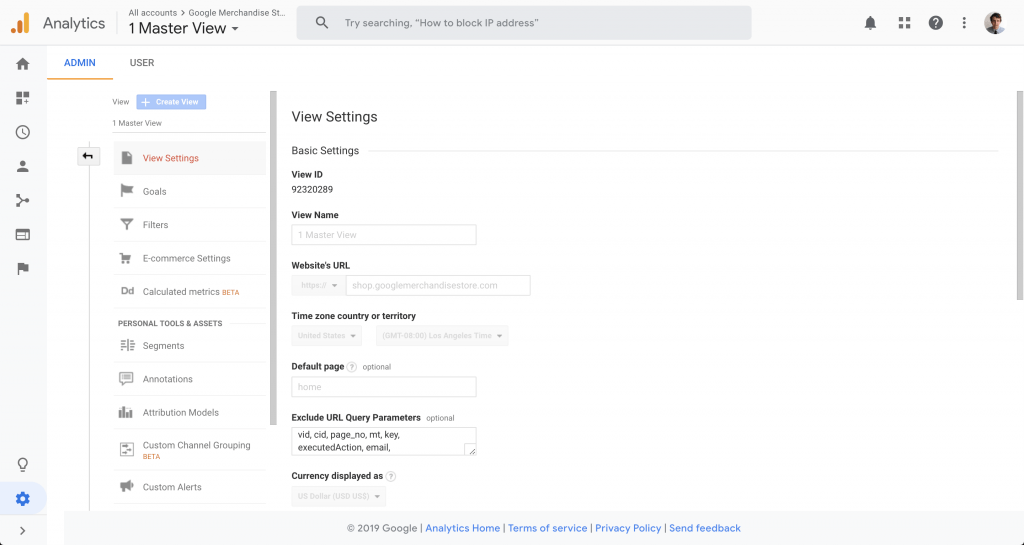
Hits will appear in the timezone that is configured in the view. Therefore, depending on the difference, your date picker could be out by a day. Make sure you keep this in mind when searching for particular hits you’ve sent.
Tip 2: Check your view filters
Again, another obvious scenario. Filters can stop your Measurement Protocol hits from being recorded in Google Analytics.
To check your filters, head to Admin > View > Filters.
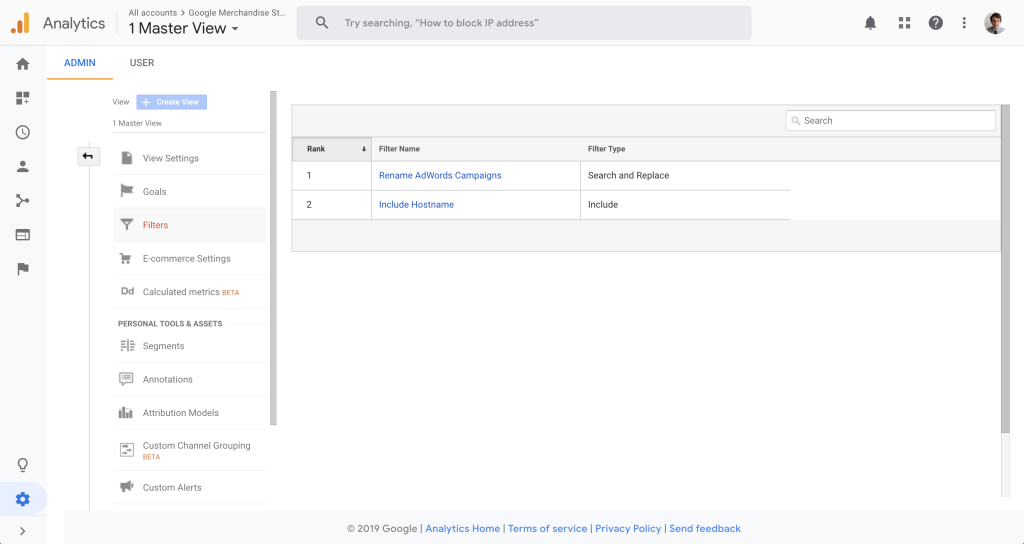
The most frequent scenario we’ve encountered is a hostname include filter. To add a hostname to your Measurement Protocol hits, use the dh parameter.
What is a hostname and why is it used in filters?
A hostname is part of a website URL that contains both the top level domain and subdomain. It is often used to filter out ghost traffic, which is created by users who utilise Measurement Protocol to send hits to random properties. In these cases, the ghost traffic is not generated on-site, so the hits do not include your hostname. Therefore, you can use a hostname include filter to only include traffic that has your hostname in the hit in that Google Analytics view.
Tip 3: Avoid libraries that auto generate client IDs
We were originally using a library to construct and send our Measurement Protocol requests. This library would automatically generate a GUID for a client ID if one wasn’t provided.
As a result, we were unable to tie this hit to previous website behaviour of a user. In addition to this, it masked an underlying issue where we were missing some client IDs. The hits were still being recorded, but they were associated with a completely new user.
Measurement protocol is straightforward and you do not need a library. Avoid them if you can, or make sure you understand the one you’re using.
What is a client ID?
A client ID is what Google Analytics uses to identify a particular website user. If someone browses your website and returns later, that activity will be recorded as the same user using their client ID. This is stored as a cookie in their web browser.
There are some limitations to client ID, including tracking cross device behaviour (although Google has access to a lot of sign in data to help address this). Keep this in mind when working with client IDs.
Tip 4: Utilise the Google Analytics debugging endpoint
When sending hits to Google Analytics, it will still give you a 200 response even if a hit is invalid. As a result, developers will often think that everything is working as expected, however, you may find that Google Analytics is not recording some hits. For example, you may be missing a client ID.
There is no way of seeing whether a hit was actually valid without using the Measurement Protocol Validation Server. Any request sent to https://www.google-analytics.com/debug/collect will return JSON that indicates whether a request was valid, if it wasn’t, tells you what to fix to make it valid.
For example, in my below request, I forgot to include a client ID.
 {
  "hitParsingResult": [ {
    "valid": false,
    "parserMessage": [ {
      "messageType": "ERROR",
      "description": "A value is required for parameter 'cid'. Please see http://goo.gl/a8d4RP#cid for details.",
      "messageCode": "VALUE_REQUIRED",
      "parameter": "cid"
    } ],
    "hit": "/debug/collect?v=1\u0026tid=UA-54516992-1\u0026uip=118.148.176.64\u0026dr=https://www.google.com/\u0026t=event\u0026ec=call\u0026ua=Mozilla/5.0%20%28Linux%3B%20Android%208.0.0%3B%20SM-G965F%29%20AppleWebKit/537.36%20%28KHTML%2C%20like%20Gecko%29%20Chrome/70.0.3538.80%20Mobile%20Safari/537.36?_anon_uip=000.000.000.0"
  } ],
  "parserMessage": [ {
    "messageType": "INFO",
    "description": "Found 1 hit in the request."
  } ]
}
We send all our hits to the debugging endpoint first, and if we ever get a “valid”:false in a hit parsing result, we log the error and original request to work out what’s going wrong.
Tip 5: Utilise the User Explorer report
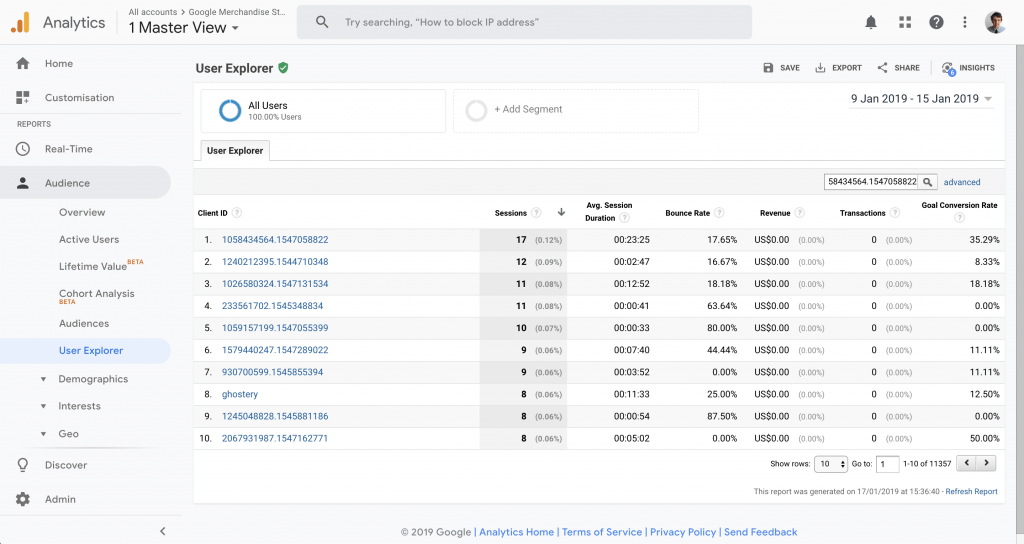
The user explorer report is a useful tool that allows you to see the activity of particular site visitors, based on their client IDs.
This means that if you want to see whether a hit was associated with the correct client ID, all you need to do is search for that client ID and look at their activity.
You can get to the User Explorer report by going to Audience > User Explorer. Make sure you set your date range correctly, and use the search bar to find particular client IDs.
Final thoughts
Google Analytics is awesome and you can use it to measure anything that’s connected to the internet. Learn from our mistakes and save yourself a bit of stress when you’re making your next cool, connected and measured thing.
Comments
There are no comments on this entry.