What is the point of having automated audits?
Disclaimer: when I say audit, I really mean a health check.
The point of Google Analytics is to guide future decisions. To increase your chance of making the right decision, you need to ensure that the data is not unexpectedly impacted by your implementation.
There are common configuration issues that can do this, which are easily fixed. However, you do not want to spend a significant amount of time pulling data to check and re-check this every time you start or update your implementation. As an analyst, you should spend your time guiding decisions, rather than pulling data.
You can automate the process of doing basic health checks on your Google Analytics data using Google Sheets and the official Google Analytics add on.
What is the point of this exercise?
Do not use this as a plug and play solution. You will find completely arbitrary logic within the “Audit Summary” sheet I have created.
The point of this article is to:
- Give you a starting point to automate your own Google Analytics data checks.
- Give you a better understanding of how the Core Reporting API works.
- Remind you that the real world is complicated. If we are to make sense of it, we must simplify it by making assumptions. Sometimes, these assumptions are incorrect.
- Despite point 3, imperfect decisions are better than no decisions. Use what you have, keep in mind assumptions and limitations in your data and make a call.
Google Sheets fundamentals
I’m not going to spend time explaining how these work. The best way to learn is to Google, or YouTube the concept. It will be hard to understand, modify and add new checks to the audit without this knowledge. I recommend you learn how to use:
- Absolute and relative references.
- String concatenation with &.
- IF functions.
- COUNTIFS functions.
- Comparison and logic like =, >, <, * *, OR functions and AND functions.
How the Google Analytics add on works
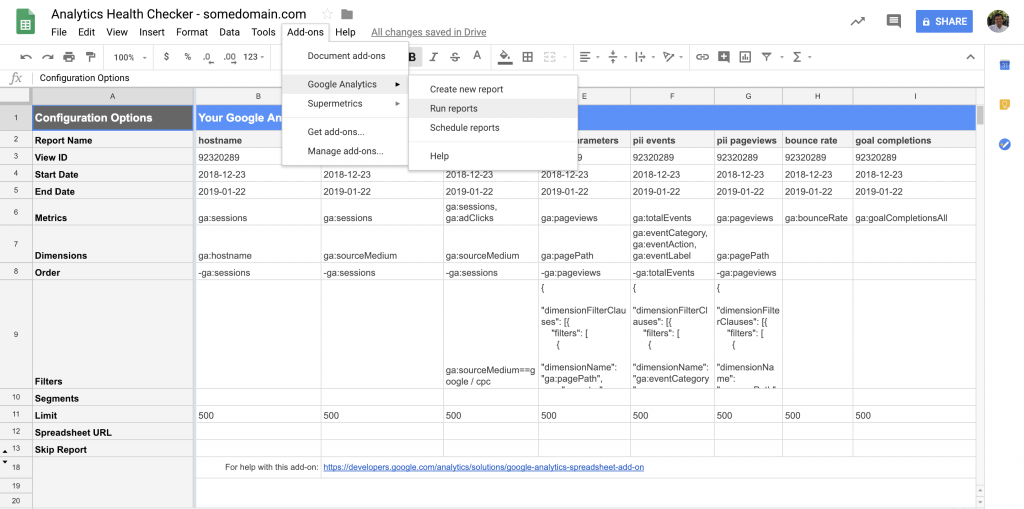
The Google Analytics add on uses the Core Reporting API to pull data from Google Analytics. Although there is a UI, it simply creates a sheet within your spreadsheet to hold the values it uses to make an API request. This sheet is called “Report Configuration”, and is created or updated when you create a new report or run a report.The configuration options
Full descriptions for these options can be in the Configuration parameter reference for the add-on.| Option | Explanation | Example |
|---|---|---|
| Report name | Gives your report a name. This determines what the sheet is called when it is created. | hostname |
| View ID | Your view ID you want to pull data from. This can be found under Admin > View > View Settings in the Google Analytics UI. | 172758398 |
| Start Date | Start date from which you want to pull data from. This is in “YYYY-MM-DD” format or there are some strings you can use like “yesterday”. | yesterday |
| End Date | End date from which you want to pull data from. | 2018-12-23 |
| Metrics | The API names of the metrics you want to include in your reports. To look up the API names, go to this link. | ga:sessions |
| Dimensions | The API names of the metrics you want to include in your reports. | ga:eventCategory, ga:eventAction, ga:eventLabel |
| Order | Specifies the order in which data is returned. | -ga:sessions |
| Filters | Adds filters to your request. Note: more complicated filters will need to follow the API’s filter object formatting. | Review the documentation for an example |
| Segments | Allows you to apply segments to reports just like you would in the Google Analytics UI. | Review the example in the documentation. |
| Limit | Allows you to specify how many results are returned. You should always specify a limit as some of your reports may be bigger than the row limit in Google Sheets. | 50 |
POST https://analyticsreporting.googleapis.com/v4/reports:batchGet
{
  "reportRequests":
  [
    {
      "viewId": "172758398",
      "dateRanges": [{"startDate": "yesterday", "endDate": "2018-12-23"}],
      "metrics": [{"expression": "ga:sessions"}],
      "dimensions":[{"name":"ga:eventCategory"},
       {"name":"ga:eventAction"},
       {"name":"ga:eventLabel"}],
       "orderBys":[
           {"fieldName": "ga:sessions",
           "sortOrder":"DESCENDING"}
       ]
       //doesn't include filter, limit etc from above
    }
  ]
}
Example report: Hostname
People can use Measurement Protocol to send hits to your Google Analytics which are not real website traffic. You should use a filter to exclude these hits, and a popular option is a hostname include filter. To check whether we need this, we can pull data from the hostname dimension and session metric based on the last 30 days. We can then check whether any of these values do not include our top level domain. The report would be configured as follows.| Config Options | Config |
|---|---|
| Report Name | hostname |
| View ID | {{your view ID}} |
| Start Date | 2018-12-23 |
| End Date | 2019-01-22 |
| Metrics | ga:sessions |
| Dimensions | ga:hostname |
| Order | -ga:sessions |
| Limit | 500 |
 Once the report is run, then it would look something like this:
Now that we have the data, we can check it using spreadsheet formulae. The add on clears all cells in each report sheet when it runs so do not create formulae from within those sheets.
In this case I have used this formula. If there is more than one reported hostname, then it says that this requires attention.
Once the report is run, then it would look something like this:
Now that we have the data, we can check it using spreadsheet formulae. The add on clears all cells in each report sheet when it runs so do not create formulae from within those sheets.
In this case I have used this formula. If there is more than one reported hostname, then it says that this requires attention.=IF(COUNTA(hostname!A16:A)=1,"Passed","Requires attention")
You can change the formatting of this sheet so it’s presented nicely and we have an example of this below.
Putting together multiple reports
The reason the Google Analytics add on is so powerful is you can drag across and use functions to generate your configuration options. I have put together a template, which has multiple reports like the above, and summarises them nicely in one sheet. The summary sheet has a description of each check, and whether it passed based off formulae. The checks and descriptions are below, so you can see what is covered. Here is the report configuration page. All you need to do is update your GA View ID, top level domain, start and end date (if you want to change these) and you’ll be good to go. Once you run the reports, all the formulae will re-calculate. Here are the formulae for the different checks. These go in the status column in the audit summary sheet.Goal Completions
=IF('goal completions'!A12>0,"Passed","Needs attention")Hostname
=IF(COUNTA(hostname!A16:A)=1,"Passed","Requires attention")
Google Ads Link
=IF(ABS('google ads link'!B12-'google ads link'!C12)/('google ads link'!B12+'google ads link'!C12)<0.5,"Passed","Requires attention")PII
=IF(AND('pii events'!D12=0,'pii pageviews'!B12=0), "Passed","Requires attention")Source/Medium
=IF(OR(COUNTIFS('source/medium'!A14:A,"*"&"(not set)"&"*"),COUNTUNIQUE(ARRAYFORMULA(LOWER('source/medium'!A16:A))),COUNTUNIQUE('source/medium'!A16:A))=TRUE,"Requires attention","Passed")Bounce Rate
=IF(OR('bounce rate'!A12<0.05,'bounce rate'!A12>0.95),"Requires attention","Passed")Internal Referrals
=IF(COUNTIFS('internal referrals'!A16:A,"*"&B2&"*")>0,"Requires attention","Passed")I didn’t want to share the full original Spreadsheet but if you copy how I’ve done this with these formulae, all you need to update is row 2 in the summary sheet. If you really want it, message me in Intercom and I will share it directly with you. Don’t be alarmed if your formulae resolve to #ref as the sheets they reference will not be created until you first run the report. Add your own tests, update my formulae and make something useful out of it.
Comments
There are no comments on this entry.